


Dashboards have had a great run. They still matter. But if your theatre managers or executives are clicking through six tabs, twelve slicers and a filter pane in Power BI just to answer:

“Which theatres had the lowest session utilisation last week, how many first-case late starts did we have, and what drove the cancellations?”
then you are not done. You have just moved the manual work from Excel to visuals.
Conversational BI flips that model. Instead of hunting for the right chart, people ask a plain language question directly into Power BI’s Q&A or Copilot interface:
“Show theatre session utilisation by campus for the last 7 days, highlight sessions with late starts or more than 20% unused time, and compare to our rolling median.”
They get a trustworthy answer they can skim, then refine with a follow up like “filter to campus A”, “compare to last month” or “export this as a slide”.
That is the point of Conversational BI. Not novelty. Not another feature. It is about reducing friction between the moment someone has a question and the moment they can act on an answer.
So what actually makes it work in a hospital environment?
Under the hood: two foundations that matter more than features
For all the talk about Copilot, chatbots and natural language, two foundations will do more for you than any shiny button.
1. A clean semantic model (your dataset)
Everything hinges on the dataset you expose to Power BI. It becomes the single, organised catalogue of business language and rules.
This is your single, organised catalogue of business language and rules:
- sessions, lists, cases and cancellations
- first case on time starts, turnaround, delays
- revenue, NWAU, per theatre and per session rates
- how you define utilisation, unused time and on time
Technically, that usually means a star schema with:
- one well formed date table
- sensible one to many relationships
- curated measures (Total, YTD, LY, Variance, per session, per minute)
- names that sound like the business, not the database
Hide the technical junk. Stage keys, surrogate IDs, internal flags, raw text fields that only an analyst understands. Ship answers, not columns. If your model reads like a foreign language to theatre managers, no chatbot will save it.
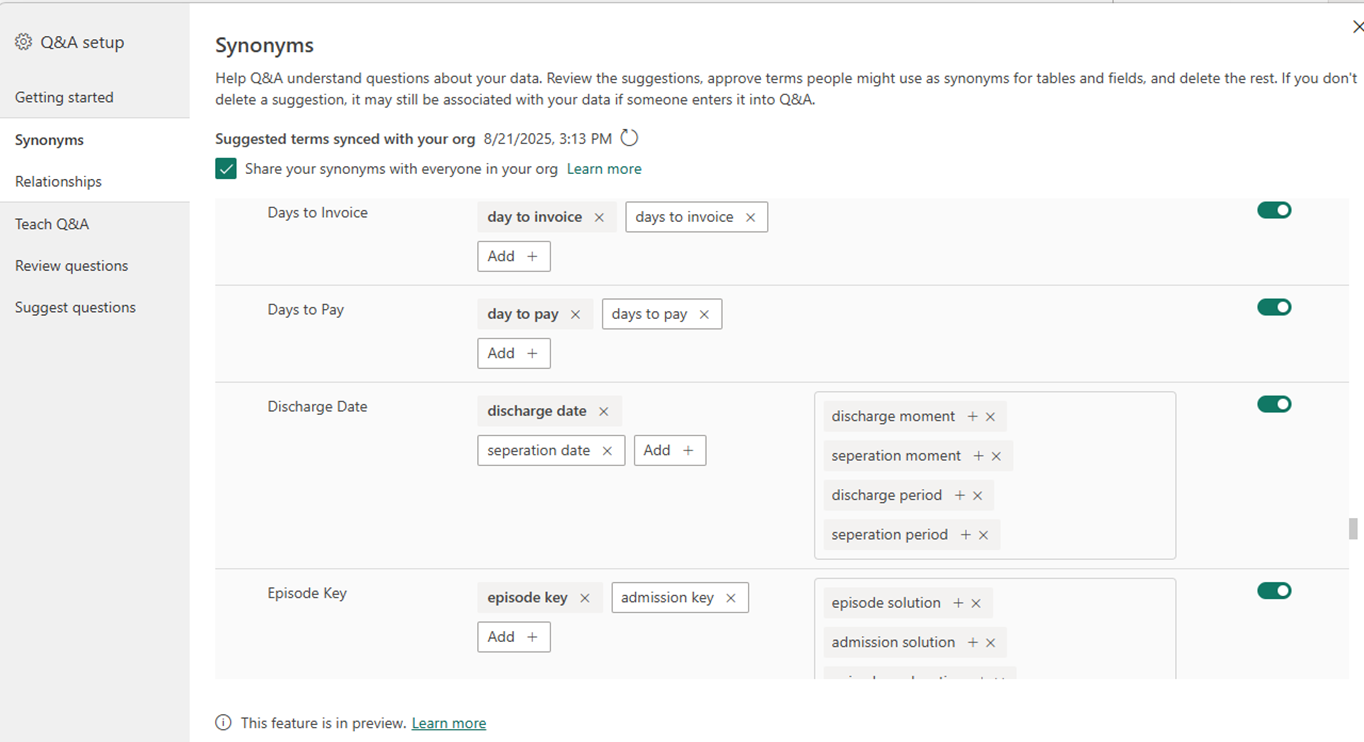
2. A linguistic model (how the bot “speaks healthcare data”)
Copilot and Q&A style tools take natural language and try to map it onto your semantic model. You can massively lift accuracy with a bit of intent.
A few practical moves:
Add synonyms: “Theatre” might be “OR”, “session” might be “list”, “facility” might be “campus” or “site”. Teach the model how your people actually talk.
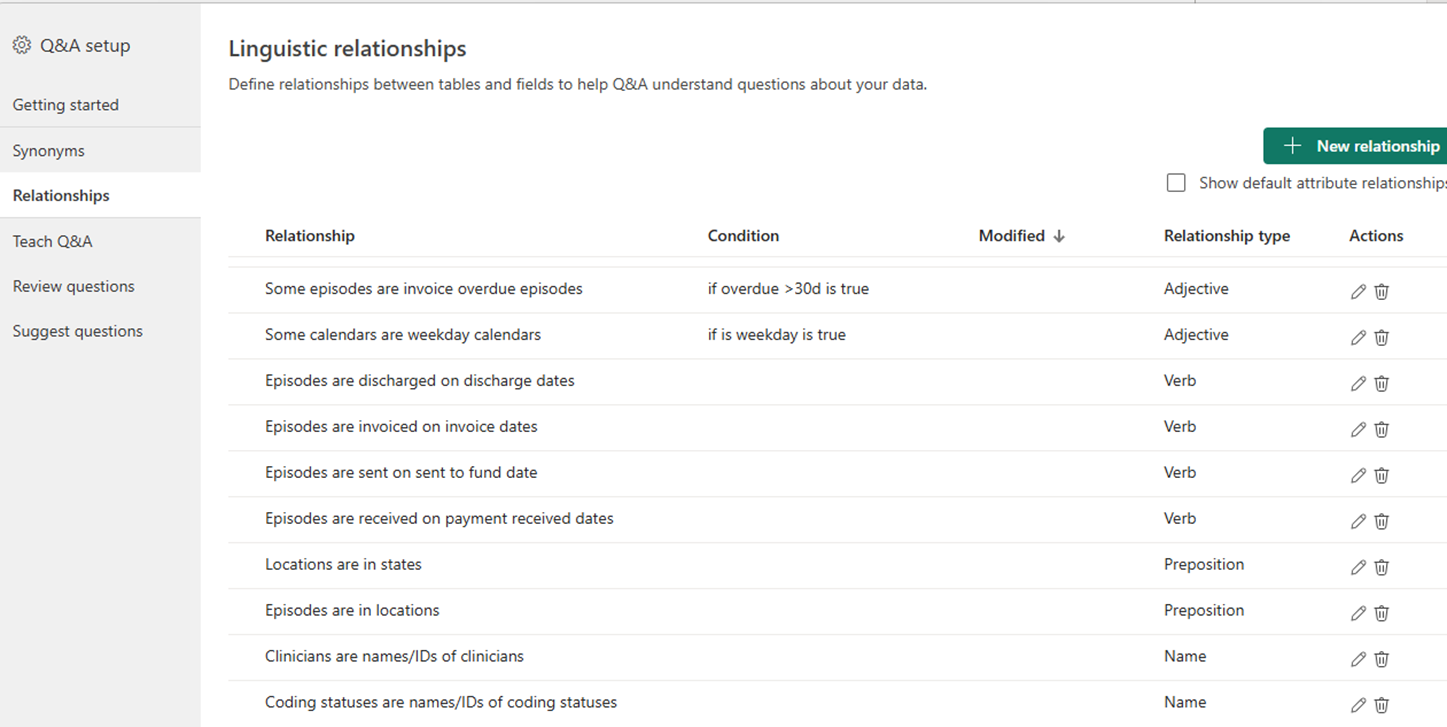
Clarify relationships and grain: Case → session → theatre → campus → organisation → local health service network.
Make sure the model knows how these roll up so that “by campus” does not accidentally land at “by case”.
Set preferred measures: If someone types “utilisation”, should that be Session Utilisation %, Case Duration %, or something else? Pick the default and mark it as preferred.
Expose time fields that “chat well”: Month Year and Week Start tend to work better for natural language than a raw Date if you report at month and week level most of the time.
Do those well and you reduce ambiguity, cut rework, and make the bot feel like a colleague who actually understands your organisation rather than a generic assistant.
Why healthcare is primed for conversational BI
Healthcare operations questions are rarely one and done. They are time sensitive, contextual and iterative.
Typical theatre questions sound like:
- “Show theatre session utilisation for the last 14 days and overlay first-case on time starts, are we sliding?”
- “Which lists had more than 30% unused time this week, and what were the cancellation reasons?”
- “Where are turnaround times skewing the schedule, and which specialties are most impacted?”
With Conversational BI, that interaction becomes:
- Ask the question in plain English.
- Skim the visual answer.
- Nudge it: “filter to campus A”, “compare to last month”, “explain the spike from last week”.
- Share or export when it is good enough for the meeting.
The real win is not that the answer appears in a chat window. It is the speed of iteration at the point of decision. Theatres, ED, outpatients, mental health and community services all have leaders who are constantly cycling through “what happened, where, why, and compared to what”.
Conversational BI fits that pattern very naturally.
Three roles, three benefits
Different parts of your organisation experience this shift differently.
Theatre managers and clinicians
- Ask questions in plain English.
- Get visual answers in seconds.
- Re prompt to drill deeper, then share results with peers for huddles and governance forums.
Self service analysts
- Build faster by reusing certified datasets.
- Let Copilot draft visuals or measures, then refine them instead of starting from a blank page.
- Spend more time on interpretation and less time on plumbing.
Enterprise BI and data teams
- Stay firmly in control.
- Govern certified models, row level security, sensitivity labels and workspace structure.
- Industrialise good conversational patterns into templates, data products and standard prompts.
This is not about bypassing BI. It is about giving people a more natural way to work with the trusted assets you already manage.
Quick wins when building a conversational ready semantic model
You do not need to replatform your whole warehouse to make progress. A few targeted tweaks can get you moving.
1. Give your date table a voice
Expose Month Year and Week Start. Hide raw Date if you want users to think in months or weeks by default. Suddenly “show the last three months by campus” behaves the way people expect without extra prompting.
2. Curate “gold standard” measures
Name them like the business speaks, for example:
- Session Utilisation %
- First Case On Time %
- Turnaround (median mins)
- Cancellations %
- NWAU dollars per theatre session
- Variance to Target
Mark them as preferred. If people type “utilisation” or “cancellations”, these should be the measures they land on.
3. Add synonyms for the top 20 entities
Use your local language:
- theatre / OR
- list / session
- case / procedure
- facility / campus / site
- specialty / service
This alone can significantly improve match rates for clinicians and operational users who never think in technical table names.
4. Hide with intent
If a column will only confuse a theatre manager, hide it. Conversation works best when the model surface is business friendly. Expose what people can safely use. Bury the rest in the background.
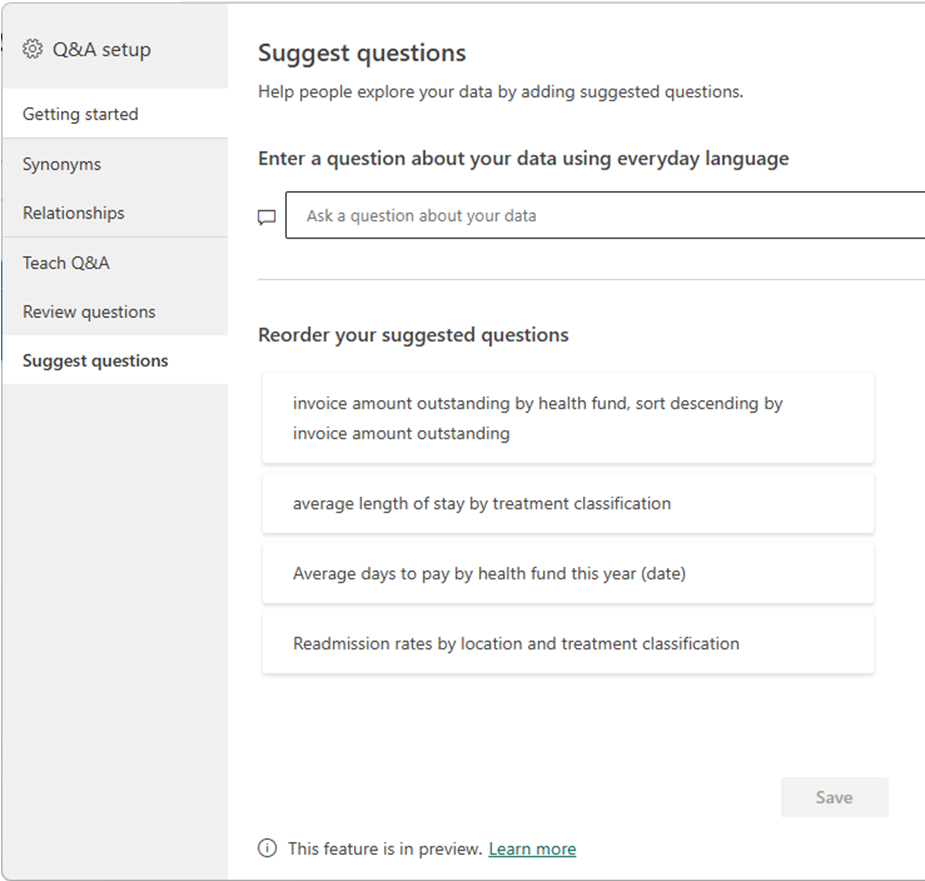
5. Seed great questions
Include suggested prompts in your Q&A pages or Copilot experience, such as:
- “Session utilisation by theatre, last 7 days vs previous 7 days”
- “First case late starts by specialty and campus, this month”
- “Top cancellation reasons and their impact on unused time, financial year to date”
- “Turnaround time distribution by theatre and weekday”
You are not just building a dataset, you are teaching people how to ask better questions.
Governance, privacy and safety are non negotiable
If it is not good enough for a board pack, it should not be a conversational source.
A few essentials:
Use certified, secured models - Row-level security: Keep Conversational BI pointed at datasets you are prepared to defend in executive and clinical governance forums.
Apply sensitivity labels and audit: Ensure outputs inherit labels and that prompts and responses are logged so you can review how the tool is being used.
Teach prompt hygiene: Encourage people to use consistent phrases like “last month”, “rolling 90 days”, “financial year to date”. Provide standard prompts right inside the app so people start from good patterns.
Conversational experiences sit on top of your existing governance, they do not replace it.
A simple sanity check before you launch
If someone asks:
“What was the session utilisation by theatre last quarter, adjusted for cancellations?”
and three different reports give three different answers, you do not have a bot problem. You have a semantic model and linguistic model problem.
Fix that first. Invest energy in the model and naming, then in synonyms and relationships. When those foundations are right, the conversation tends to take care of itself.
Join the conversation
Where could Conversational BI remove the most friction in your world right now? Late starts, cancellations, turnaround bottlenecks, theatre scheduling huddles, ED flow, mental health bed management, outpatient waiting lists?
Think anywhere you have reasonably well-defined data and people who are constantly asking “what is happening and why?”.
Drop a scenario in the comments. If you have already tried Copilot or Q&A, what surprised you, good or bad?
If you find yourself scoping “just one more dashboard”, it might be time to start teaching your data to talk.
Part 2 soon.
Written by: Luke Garton, proofed by AI
Our Partners
.png)


Contact us


