


In this part, I’ll coach you through the “before and after” of a chat-ready semantic model – starting with a typical, report-centric model and then showing the small but critical tweaks that make it work for natural language questions.
We’ll then walk through a fast plan-do-check-act (PDCA) loop you can run with a handful of real users, so you can capture how they ask questions, tighten up synonyms and measures, and quickly close the gap between what they say and what the model understands.
Stop hoping Copilot will guess what you mean. Teach it your language.
By the end, you’ll have a practical pattern you can reuse across other domains, and a semantic model that’s genuinely ready for Copilot and conversational BI, not just “another dashboard”.
Structure & talking points
Step 1 - Before/After: what a “chat-ready” model looks like.
Below are the key areas worth investing time in. You don’t have to fix everything on day one – but the more rows you can nudge from Before to After, the better Copilot will behave:
Teaching Copilot to say “no” properly
You finally get your surgeons using Copilot.
One of them types:
“Show my elective theatre utilisation for high-risk colorectal cases from the satellite campus over the last 5 years.”
Copilot spins… and comes back with something useless: a blank visual, a vague no data found, or worse, a confident answer based on completely the wrong thing.
From their point of view, Copilot has just failed.
From your point of view, Copilot has faithfully reflected the semantic model:
- You only have data from 2022 onwards
- You don’t capture “high-risk” as a flag yet
- The model only includes the main hospital campus, not satellite sites
The problem isn’t that the AI is “wrong”. The problem is that it doesn’t know how to explain the scope of your theatre data.
That’s where AI Instructions come in.
This is where we’ll stay in the world of theatres, surgeons and utilisation, and walk through how you can use AI Instructions in Power BI to:
- Help theatre users understand what the model can and can’t answer
- Turn “no data” into a helpful explanation, not a dead end
- Build more trust in Copilot for real operational questions
Quick refresher: what are AI Instructions?
Power BI’s AI Instructions are a text prompt you attach to the semantic model that Copilot reads every time it answers a question.
They let you:
- Explain business language and metrics in your own words
- Guide how Copilot should interpret ambiguous prompts
- Tell Copilot what data doesn’t exist so it can say “no” clearly rather than hallucinate
End users never see this text directly – they only see the impact in better, more honest answers. Microsoft documentation: https://learn.microsoft.com/en-us/power-bi/create-reports/copilot-prepare-data-ai-instructions
Start with one clear section in your AI Instructions dedicated to scope.
1## What this semantic model contains
2- This model contains theatre session and case data for your Hospital A (public campus only).
3- It does not include activity from private partner hospitals or other health services.
4- Date range: data is complete and reliable from 1 July 2022 onwards.
5- Granularity:
6  - Sessions: one row per scheduled theatre session (morning/afternoon/evening).
7  - Cases: one row per case booked into a session.
8If the user asks for data outside these scopes (other hospitals, before July 2022, or after the latest refresh date), explain that this semantic model doesn't contain that data and suggest they restrict their question to Hospital A and the supported date range.Example in action:
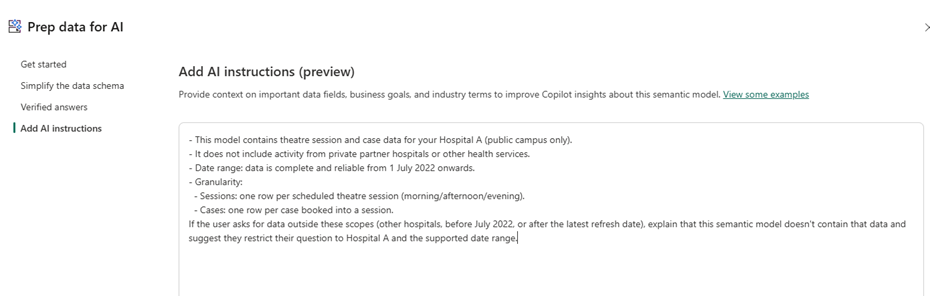
You can still answer related questions using available attributes such as procedure type, urgency category, list type, session type and surgeon. Never invent or infer high risk status, ASA, or similar attributes that aren't present in the data.
Two key principles fo success
- Be specific and concrete – name the hospital, campuses, date range, and missing attributes.
- Give Copilot language to reuse – phrases like “this model doesn’t contain…” and “restrict your question to…” will often surface word-for-word in Copilot’s replies – which is exactly the behaviour you’re aiming for.
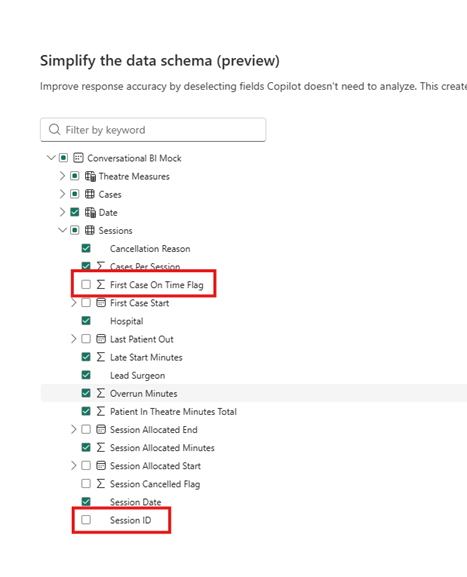
Pro Tip – don’t forget to hide technical or low value columns
A fast “chat-ready” PDCA loop
Two weeks, real outcomes.
For conversational BI you’re not just “building a model” – you’re teaching it how your people talk and what a good answer looks like when it comes back.Below is a fast PDCA loop you can tune to your organisation’s pace (around a fortnight works well) that keeps that learning tight, practical, and grounded in real questions from your users.

Plan (Day 1–2)

- Pick 1–2 priority questions (theatre utilisation is perfect):
- “Which theatres are under-utilised this month?”
- “Where do first-case late start cluster by weekday, and by which surgeon?”
- Define what a good answer looks like: exact measure, grain, time range, default visual, and the follow-up questions you expect (e.g., “by specialty”, “by campus”).
- Prep the model: rename fields, mark gold measures, add synonyms, expose friendly time fields, hide tech columns.
Do (Day 3–7)

- Run a pilot with 3–4 users (theatre managers, theatre nurse and a data analyst).
- Let them use Copilot naturally.
- Capture: their exact phrasing, follow-up prompts, dead-ends, and any manual fixes they had to do for the prompting to understand what they were referring too.
Check (Day 8–10)

- Review the chat transcripts + resulting visuals against your “good answer” spec.
- Note misfires: determine if it was the wrong grain, wrong measure, missing filter (e.g., cancellations not excluded) or just an odd visual choice by Co-pilot.
Act (Day 11–14)

- Fix the model:
- add/adjust synonyms,
- rename fields,
- add calculated measures,
- set default summarisation,
- tweak default visuals,
- update suggested prompts.
- Rinse/repeat next cycle with one new question or a larger cohort.
Over a few cycles you’ll see misfires drop away, and the model will feel less like a gimmick and more like a reliable, conversational front door to your data.
I’d love to hear where Copilot and conversational BI have tripped you up so far – what’s been hardest or most frustrating point you have encountered?
Have you had any quick wins? Let me know in the comments below.
Written by: Luke Garton, proofed by AI
Our Partners
.png)


Contact us


