


The CFO’s Early-Warning System for Funding Risk
CFOs and executive directors in mental health services face mounting pressures:
- Late recognition of funding risks that leave little time for corrective action.
- Fragmented spreadsheets and multiple versions of the truth across subcentres.
- Seasonal volatility and structural shifts in activity that traditional methods often fail to capture.
- Rising accountability to boards and government, with a need for transparent, governed models that stand up to scrutiny.
Through our work with a Victorian Health service, we’ve seen these challenges firsthand. The learnings from this collaboration shaped a forecasting framework that is not only transparent and auditable but also provides CFOs with earlier sightlines into funding risk than traditional methods allow.
To get here, we worked closely with a Victorian Health service to understand the day-to-day frustrations of Finance teams and the operational realities of mental health programs. What we heard was consistent: too many spreadsheets, too much lag in recognising variance, and too little trust that forecasts reflected reality. Together, we tested different approaches inside their governed Power BI environment—aligning one semantic model, one calendar, and one set of definitions—to ensure both Finance and Operations could see the same story. The result is the dashboard you see here: an executive view that translates complex forecasting into a transparent, auditable, and actionable tool for decision-making.
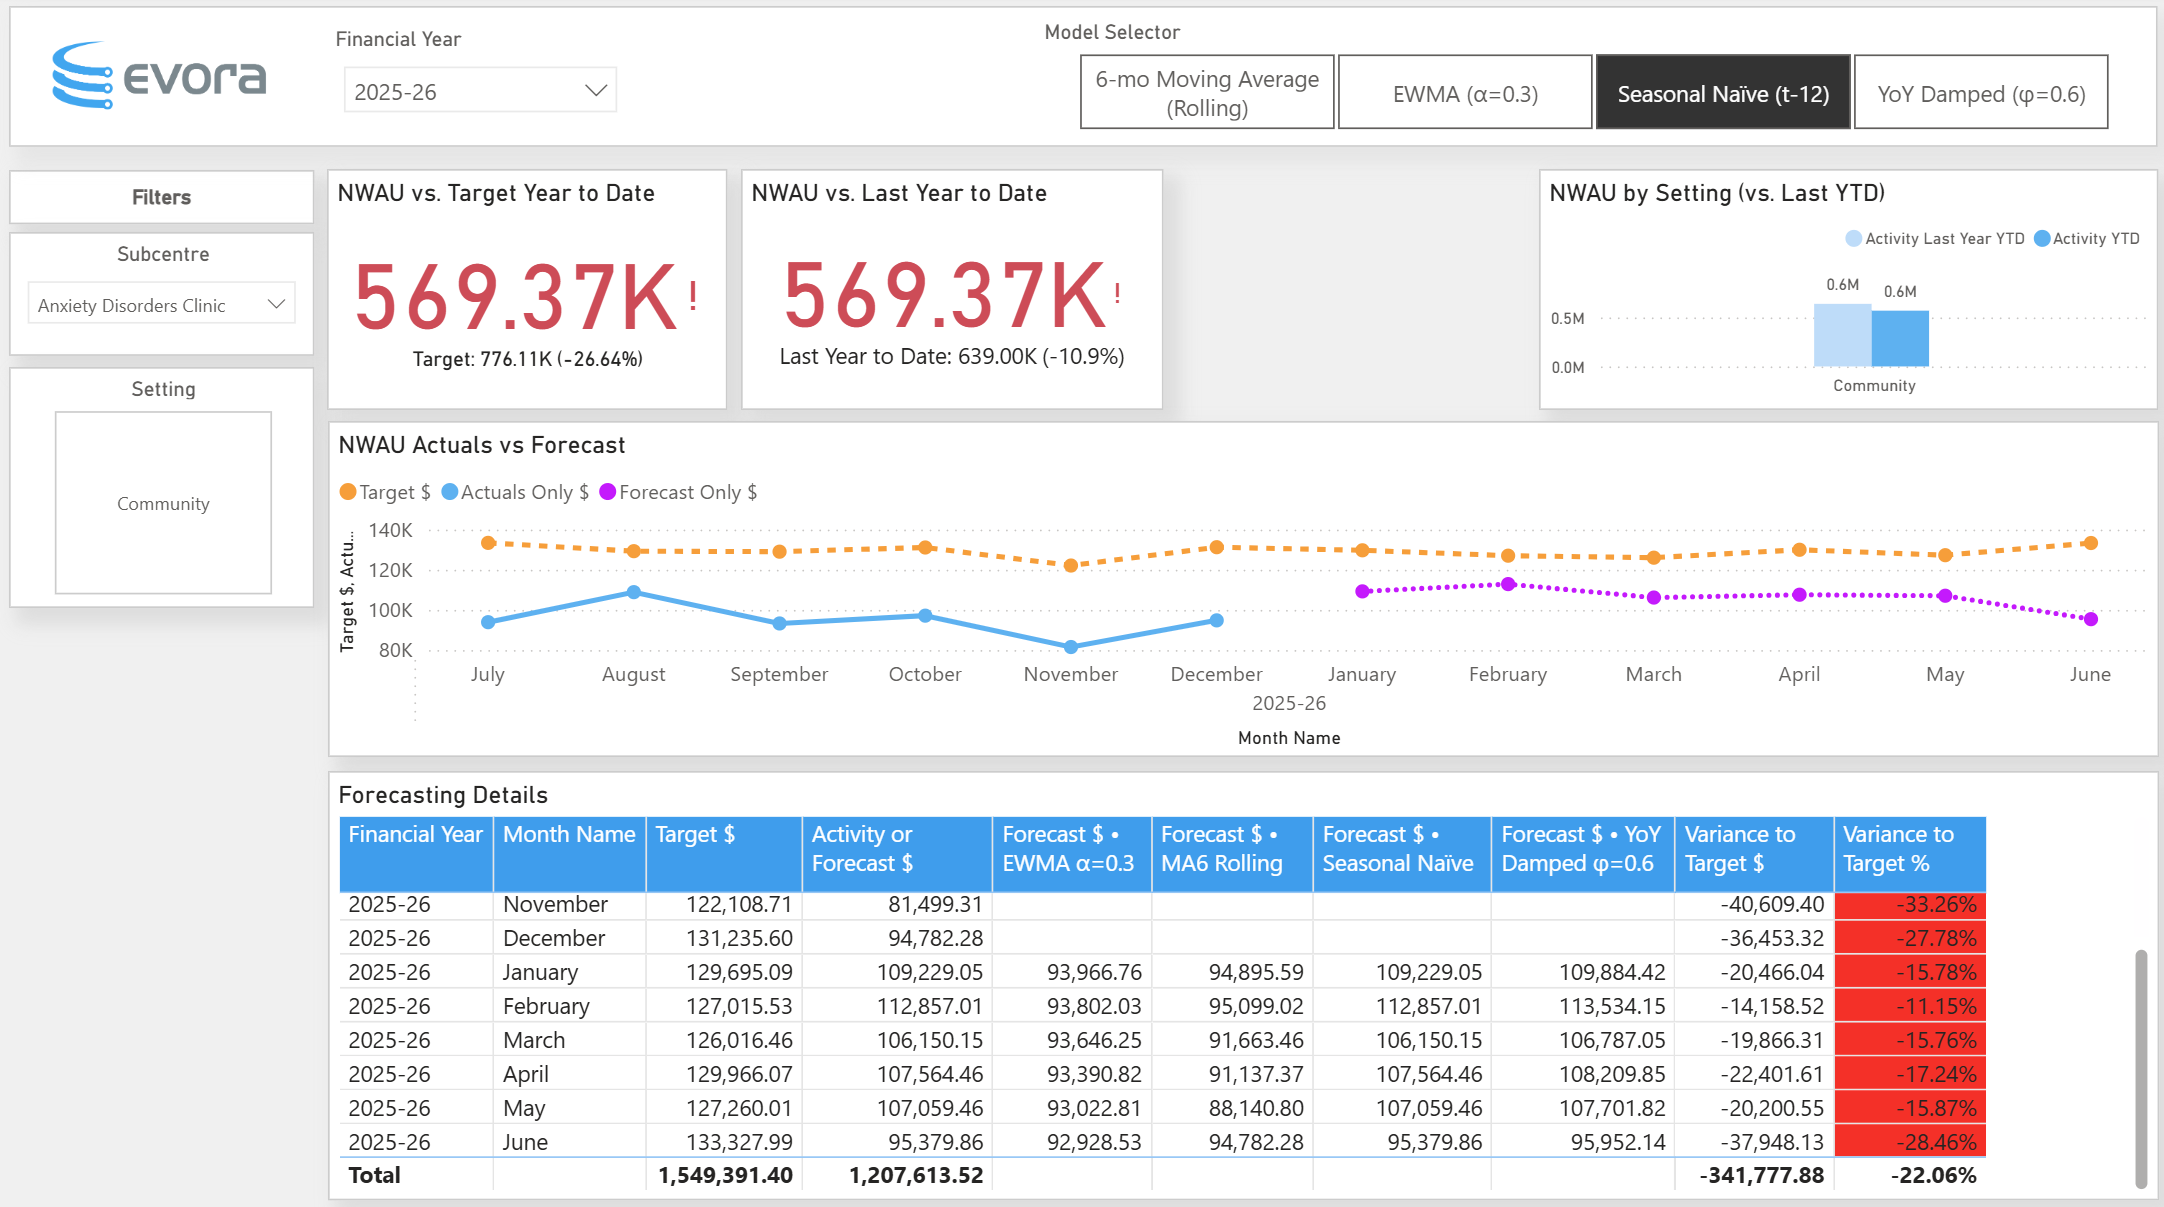
The Model Panel: At a Glance
One of the most frequent questions we receive is:
why use four forecasting models rather than one?
The reality is that no single model consistently performs best across all programs and subcentres. Different services display different behaviours: some highly seasonal, others subject to gradual structural change, and still others experiencing sudden shifts in demand. Relying on a single forecasting approach creates blind spots.
To overcome this, we adopted four simple, proven models—not overly complex, but effective across a range of service profiles. This gives leaders a balanced panel:
- Flexibility: Subcentres can use the model that best reflects their behaviour.
- Comparability: CFOs see a clean, consistent portfolio view across the organisation.
- Confidence: When multiple models align, the risk signal is stronger.
This approach was validated in our Victorian Health service partnership, where side-by-side comparisons revealed different models surfaced different risks, empowering leaders to act sooner.
Funding Early Warning Index (FEWI): Our Breakthrough Innovation
Perhaps the most transformative element of the framework is the Funding Early Warning Index (FEWI), which is our innovation designed to rank funding risk on a 0–100 scale.
FEWI blends multiple dimensions:
- Near-term forecast variance (1 month and 3 months ahead).
- Historical performance, factoring in recent misses.
- Model consensus, strengthening the signal where different models agree.
- Dollar impact weighting, ensuring the highest-value risks rise to the top.
Unlike traditional variance tables, FEWI provides an intuitive risk score that CFOs can use as a portfolio lens. At the Victorian Health service, FEWI proved particularly valuable in surfacing community programs at risk of tightening late in the year, giving leadership teams the early insight required to intervene.
By weighting for dollar impact, FEWI prioritises material risks over noise—a design principle refined through real-world application. It is, in many ways, Evora’s signature innovation: a finance-first risk indicator tailored for the unique funding environment of Australian public health.
The Watchlist: Practical Focus for Executives
The watchlist combines near-term projections, recent performance, and FEWI ranking into a concise view:
- Near-term lens: Forecasts for the next month and next quarter.
- Recent form: Track misses in the last three months.
- Consensus check: See if two, three, or all four models signal risk.
- Volatility insight (optional): Residual variation flags unstable services.
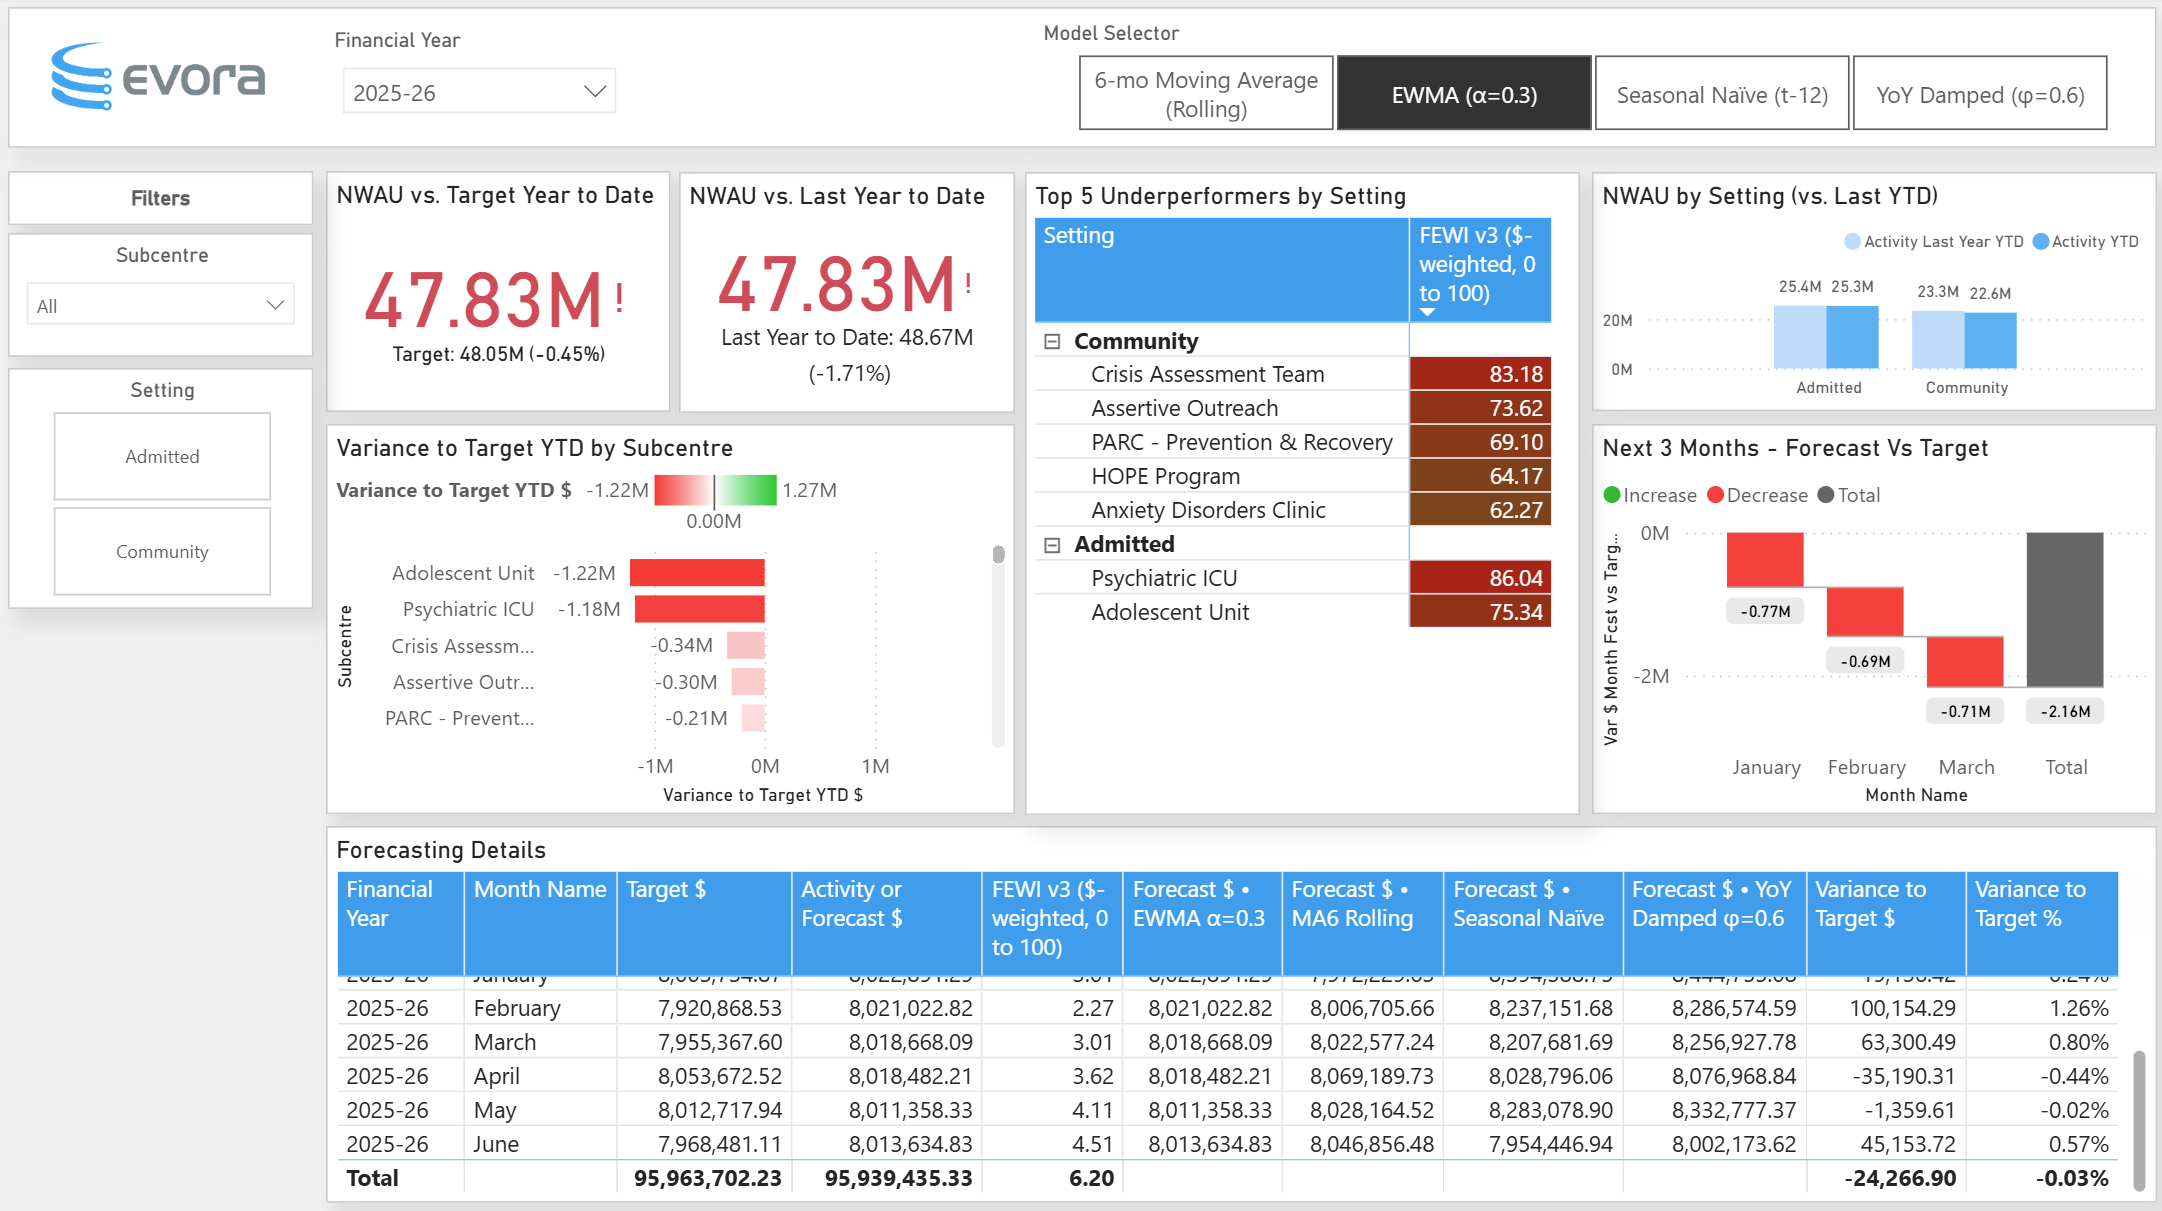
The result is an actionable prioritisation tool—helping CFOs cut through the noise and focus on the most material risks.
What We Learned from a Victorian Health Service
Key learnings from implementation:
- Earlier visibility matters: Using FEWI avoided surprises at EOFY by acting in February instead of June.
- Different models fit different behaviours: Community services leaned on EWMA, while hospital-based activity found YoY Damped more reliable.
- Conversations shifted: Leadership began focusing less on retrospective explanations and more on forward-looking interventions.
These learnings directly shaped the refinements to FEWI v3, which now blends risk, trend, and dollar impact into a practical decision tool.
Governance, Transparency & Accuracy
From the outset, the framework was designed to be:
- Governed: Hosted within the Microsoft Power BI estate, ensuring compliance with health sector security requirements.
- Resilient: Guardrails such as growth floors and smoothing prevent distortion.
- Actionable: With watchlists and traffic-light signals embedded in reports, executives can move from insight to intervention seamlessly.
Executive Takeaway
For CFOs and executive directors in mental health divisions, the message is clear:
- Earlier sightlines into funding performance reduce EOFY shocks.
- Transparency builds trust between Finance, Operations, and the Board.
- Portfolio-level risk ranking (FEWI) ensures the most material risks are addressed first.
What began as a forecasting framework has become, through Victorian Health service collaboration, a finance-first early warning system for NWAU funding risk.
Reflections
Every health service grapples with forecasting accuracy, seasonality, and late risk recognition. The critical question is:
- How are you currently forecasting, and what confidence do you have in those models?
- If you were to rank your subcentres by risk today, would you know which ones require urgent intervention?
We invite CFOs and executives to reflect on these questions—and to share how their forecasting methods surface funding risks early enough to act. Our experience with Victorian Health services has shown that bringing forecasting into a governed, transparent framework can transform both confidence and decision-making.
Written By: Bernard Herrok, proofed by AI.
Our Partners
.png)


Contact us


