


Support at Home has now been live for a while now.
The providers who are struggling are not struggling because SAH is complicated. They are struggling because SAH requires five separate data streams to reconcile against each other, and most organisations are watching at most two of them in any systematic way.
The consequences are predictable: unsubmitted claims, undetected subcontractor invoice variances, clients approaching budget ceilings with no warning, and rejected claims sitting unresolved in someone's inbox. None of these are fatal individually. Together, they add up to a gap between the revenue you have earned and the revenue you have received — and a growing exposure if Services Australia comes looking.
We built a reconciliation workbook to address this. It is free. You can download it at the end of this article.
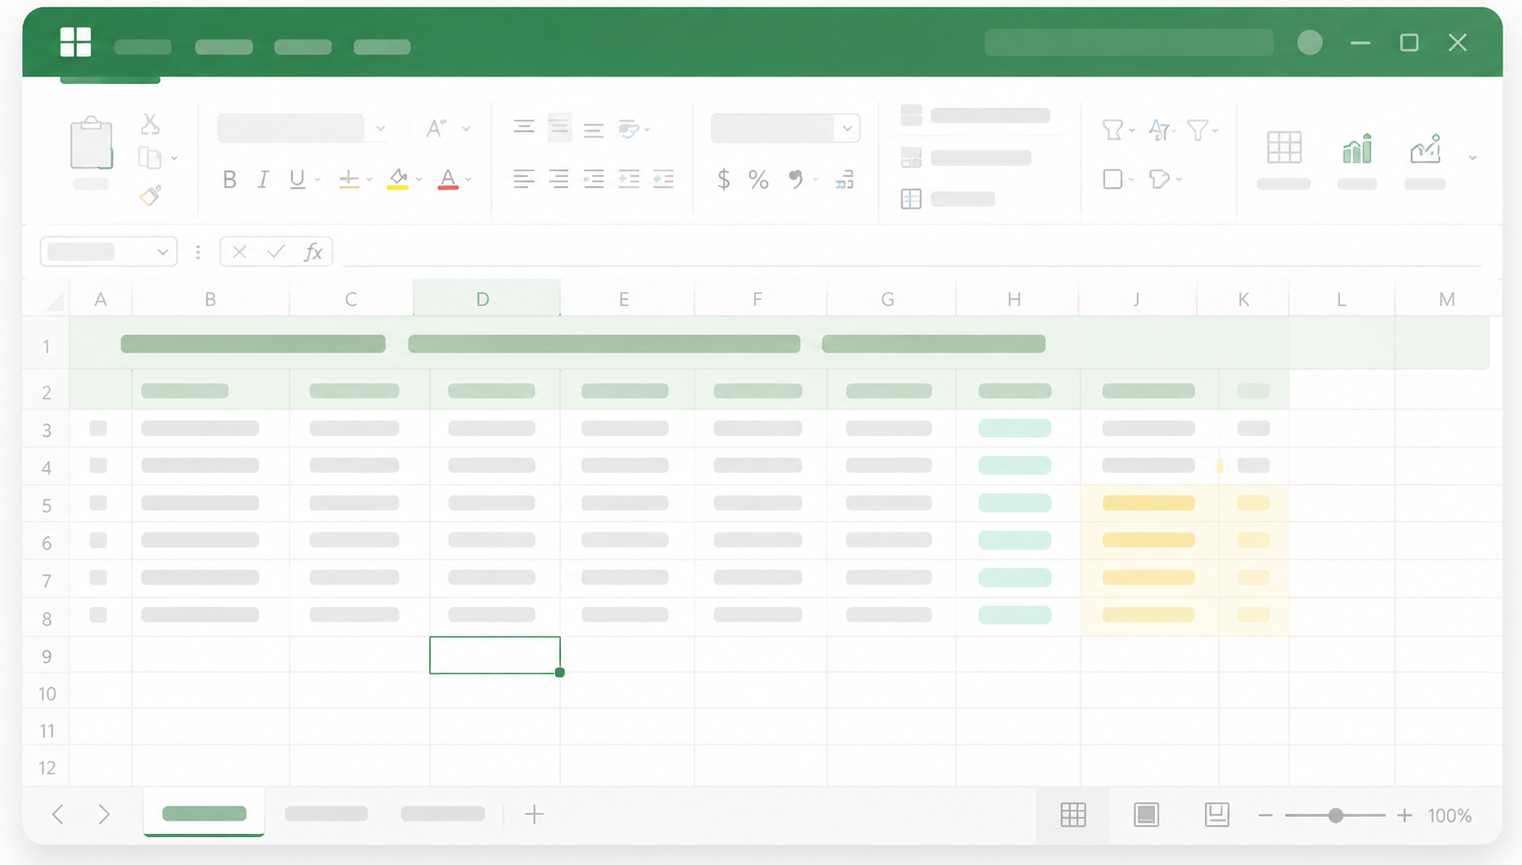
Before you read further: this is not a per-client tracking file. It is a portfolio tool. One workbook, every active client, one view. Open it on Monday morning and you have your total unclaimed delivery value, which clients are approaching their quarterly budget ceiling, every rejected claim pending action, and every unmatched subcontractor invoice — all calculated automatically from the data across the other five tabs. That is a different thing from a logging spreadsheet.
Before you download it, here is what is in it and how it works — because understanding the logic matters as much as having the file.
The five data streams
SAH reconciliation requires you to hold five things in alignment at once:
- What is approved for each client (care plans and budget allocations)
- What was actually delivered (service delivery records)
- What subcontractors and third parties are billing you for
- What you have submitted to Services Australia
- What Services Australia has paid, rejected, or queried
Each of these exists somewhere. The problem is that they rarely exist in the same place, in the same format, with the same identifiers. A client might be "Margaret Henderson" in your care management system, "M. Henderson" on a subcontractor invoice, and a nine-digit reference number on your Services Australia portal. These are the same person. Your reconciliation process needs to know that.
The workbook creates a single place where all five streams connect, using a shared client identifier as the spine.
What each tab does
Client Master
This is the identity layer. One row per client. Every other tab in the workbook references a Client ID that exists here. If a record appears anywhere else in the workbook without a matching Client ID, it is an error — either a data entry mistake or a service delivered to a client you cannot account for.
This tab also holds the approved quarterly budget for each client by support level. It is the ceiling against which everything else is measured.
Care Plan Register
This tab captures committed spend by service type, by client, by support period. It translates the care plan — a clinical and administrative document — into a financial baseline.
It answers the question your finance team needs answered before any claim is submitted: is the total value of services planned for this client within their approved budget envelope? If not, the problem needs to be resolved at the care plan level before it becomes a claims problem.
Service Delivery Log
This is the claims source document. One row per service delivered, regardless of whether it was delivered by your internal workforce or a subcontractor.
Every claim you submit to Services Australia should trace directly back to a row in this log. If it cannot, you are claiming something you cannot substantiate in an audit. This tab is also where unsubmitted deliveries surface — services you have provided and not yet been paid for.
Subcontractor Invoice Register
This tab captures every invoice received from an external provider, matched back to the corresponding row in the Service Delivery Log.
The match is where the work happens. Does the subcontractor's billed hours match your record of hours delivered? Does the service type match? Does the client identifier resolve to the same person? Any variance between what the subcontractor has billed and what your delivery log shows is flagged before the invoice is approved for payment.
This is the tab that most organisations do not have. It is also where the largest avoidable losses tend to originate.
Claims Register
One row per claim submission. This tab tracks the full lifecycle of each claim from submission to payment — including rejections, partial payments, and items under review.
Rejected claims are the most common source of unexplained cash flow gaps at end of quarter. Services Australia's rejection reasons are often correctable — wrong date format, incorrect service code, duplicate reference. This tab makes rejections visible and forces a decision: resubmit with correction, or write off.
Variance Dashboard
This is the management view. It does not require manual updates — it is built on formulas that pull from the other five tabs.
It shows, at any point in time: deliveries not yet claimed; claims outstanding beyond 14 days; rejected claims not resubmitted; subcontractor invoices unmatched beyond seven days; clients within 10% of their quarterly budget ceiling; and any clawback notices received and unresolved.
If a CEO, CFO, or Operations Manager looks at nothing else in the workbook, they should look at this tab every Monday morning.
TIP: this is a portfolio tool, not a per-client file
This workbook is designed to manage all of your active clients in one place. The Variance Dashboard only makes sense that way — it is how you see your total unclaimed delivery value, your total rejected claims, and which clients are approaching their budget ceiling, all at once. If you run a separate file for each client, that picture disappears and you are opening a separate file for every client on Monday morning. The architecture works because everything traces back to one shared client identifier.
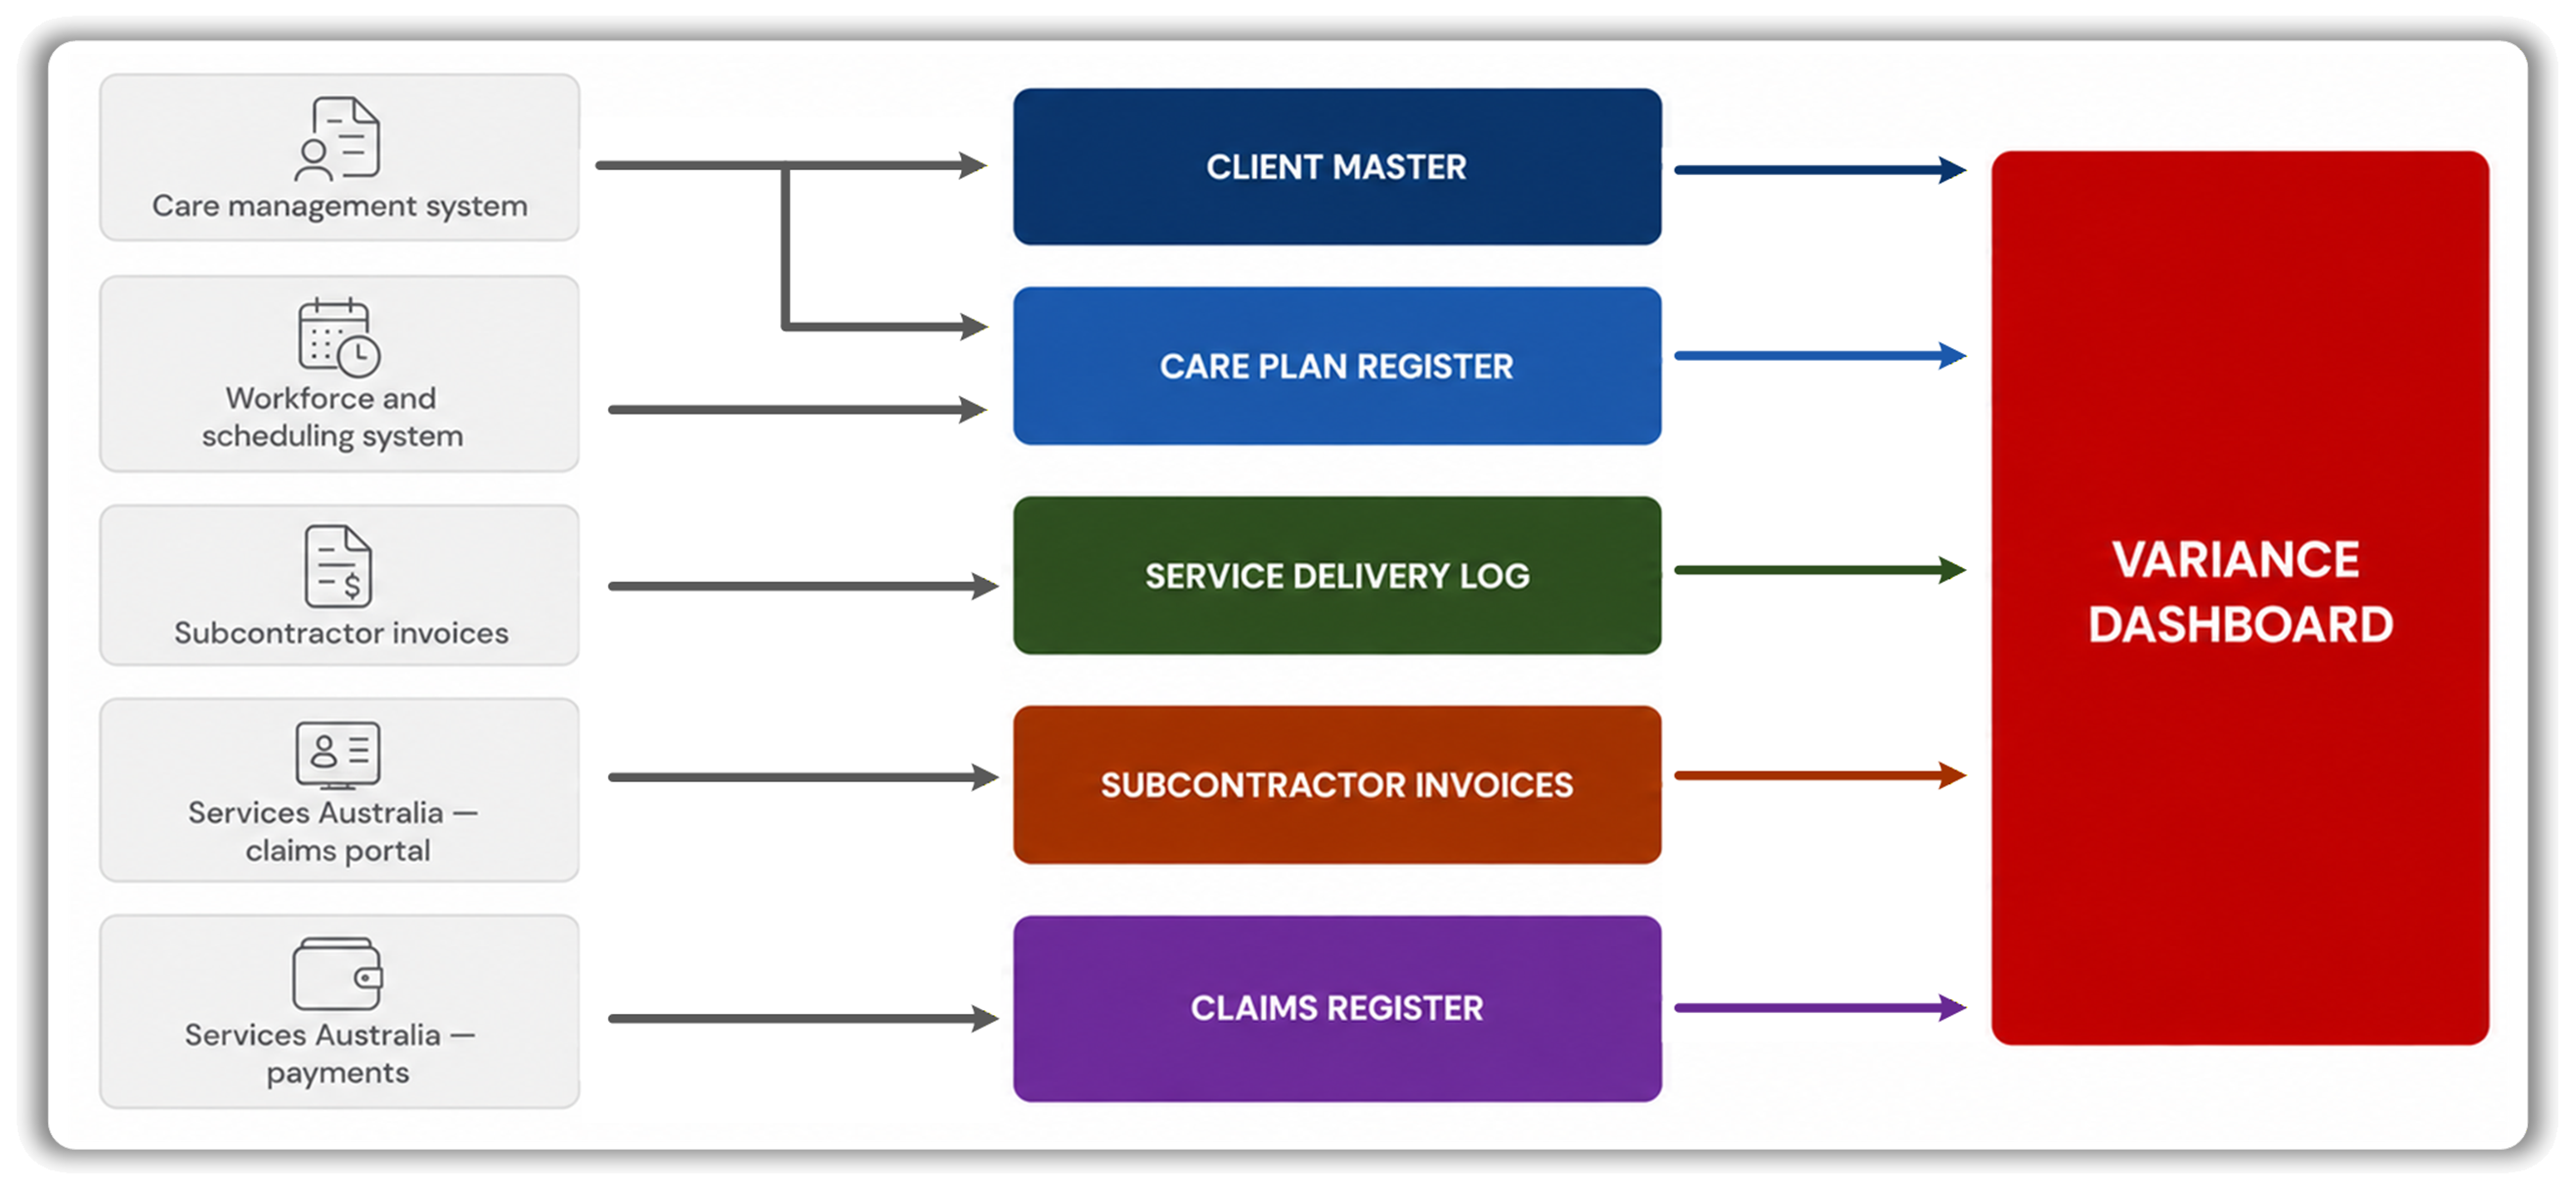
How the tabs interact
The workbook is not six independent spreadsheets. It is one connected system.
The Client Master governs identity across every other tab. The Care Plan Register sets the budget ceiling that the Claims Register measures against. The Service Delivery Log is the source document for both the Claims Register (what to claim) and the Subcontractor Invoice Register (what to validate against). The Variance Dashboard aggregates outputs from all five.
Change a budget allocation in the Care Plan Register and the Variance Dashboard immediately reflects how many clients are now at risk of exceeding their ceiling. Match an invoice in the Subcontractor Register and the outstanding invoice count on the Dashboard drops. Resubmit a rejected claim and it clears from the rejections view.
This is the behaviour you need from a reconciliation system: one change in one place, propagated everywhere it matters.
Where this breaks down
This workbook is designed for providers managing up to approximately 150 active clients with mixed delivery models. It works well. It has limits.
It has no audit trail. If someone changes a claim amount, there is no record of who changed it or why. It requires manual data entry — every number was typed by a person who copied it from another system. It cannot automatically resolve entity matching: if your care management system and a subcontractor invoice use different client identifiers, a human has to make the match. And it does not integrate with anything — it sits alongside your other systems, not inside them.
For providers at this scale, those limits are manageable. The discipline of the process compensates for the limitations of the tool.
For providers beyond this scale — or already navigating reconciliation problems now, preparing for a prudential review, or managing third-party delivery across multiple sites — the manual layer starts costing more than it saves.
We know this because we have built beyond the workbook. Evora's SAH toolkit includes a reconciliation engine that ingests directly from your source systems and resolves entity matching automatically; an audit layer that records every change with full history; a portfolio dashboard that surfaces budget risk and claims exposure across your entire client base in real time; and management dashboards that produce the reporting your leadership and finance teams need without anyone compiling it by hand each month.
If you have outgrown the spreadsheet — or the reconciliation issues are already there and you need to move quickly — we are happy to talk. The workbook in this article is where the logic lives. What we have built is where it scales.
Download the workbook
The template is free. We ask for only your name and email address so we can send you the Excel file and so we know who finds this useful. If we reach out, it will be by email — one message, no hard sell, and no subscriptions without your consent.
If you use it and find something that should work differently, let me know. We will update the template.
Written By: Bernard Herrok, proofed by AI
Our Partners
.png)


Contact us


